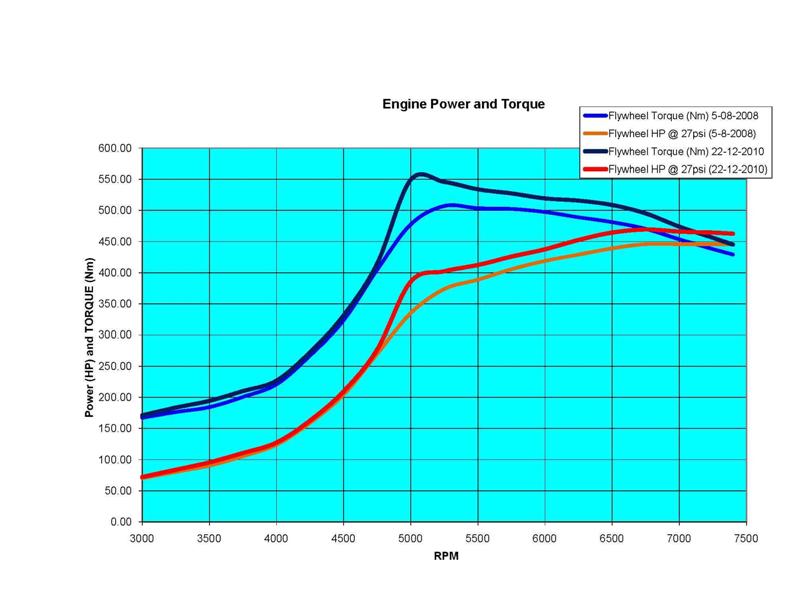
A graph for comparison:
DISCLAIMER
1. This is for comparision only
2. The flywheel power is just a number and based on dyno figures times 1.25 for losses (yes/no or other it is just a figure)
3. One could change this to any other percentage, so take it with a grain of salt.
Sumary: This is most useful for potential torque figures more importantly indicates the curve...CheeRS.